Navigating the Dashboard
This page explains how to navigate the Mastra Cloud dashboard, where you can configure your project, view deployment details, and interact with agents and workflows using the built-in Studio.
Deploy and monitor your Mastra applications with Mastra Cloud. Get automated deployments, detailed observability, and a built-in Studio for testing agents and workflows.
OverviewDirect link to Overview
The Overview page provides details about your application, including its domain URL, status, latest deployment, and connected agents and workflows.
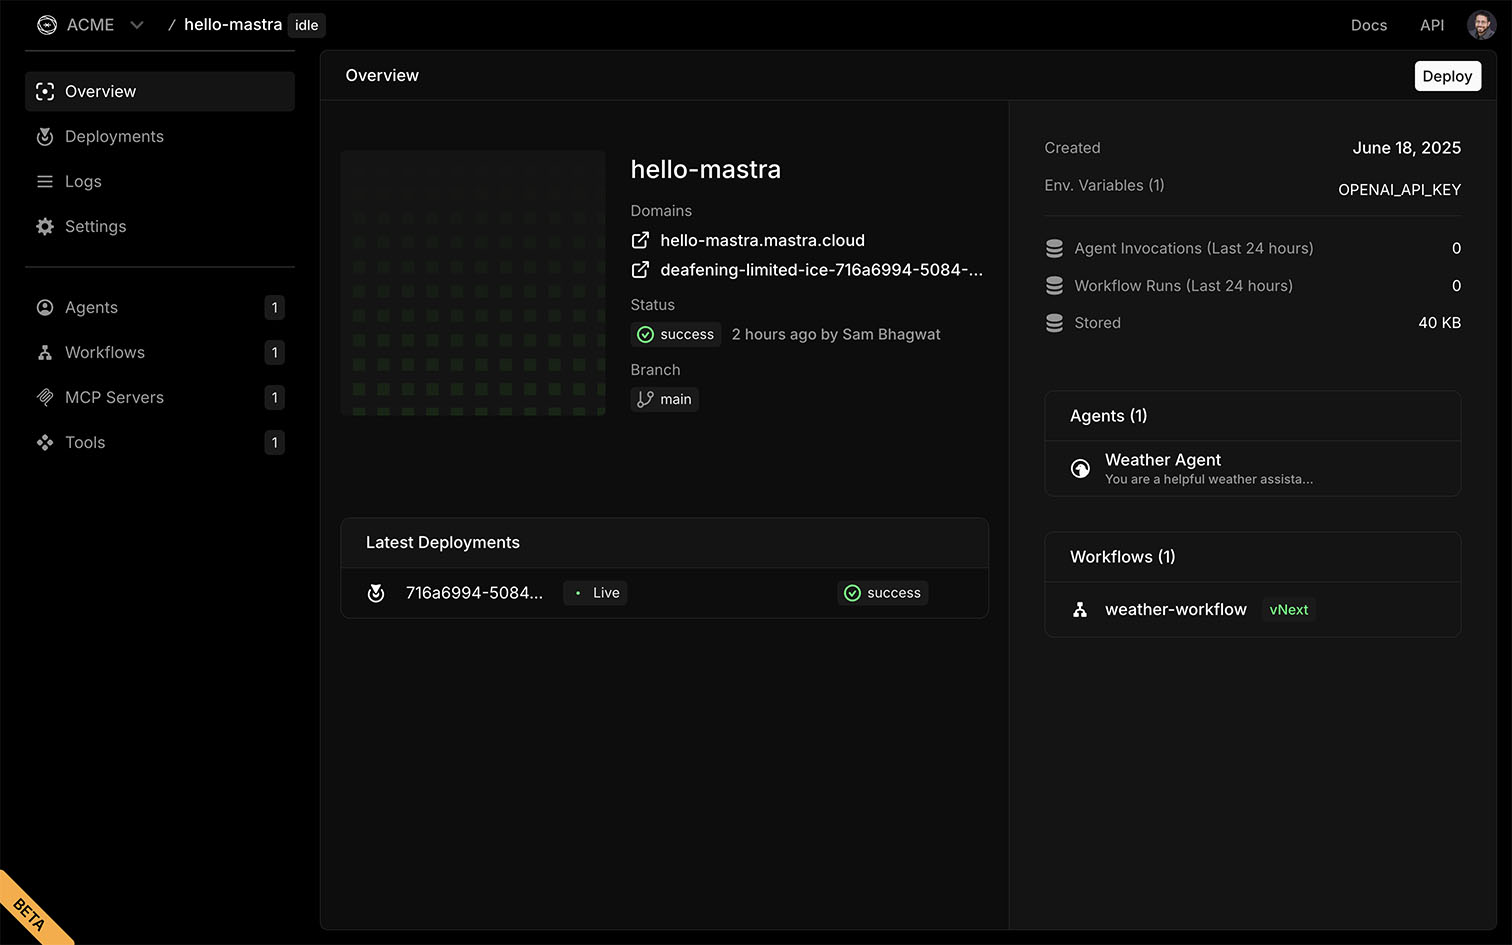
Key features:
Each project shows its current deployment status, active domains, and environment variables, so you can quickly understand how your application is running.
DeploymentsDirect link to Deployments
The Deployments page shows recent builds and gives you quick access to detailed build logs. Click any row to view more information about a specific deployment.
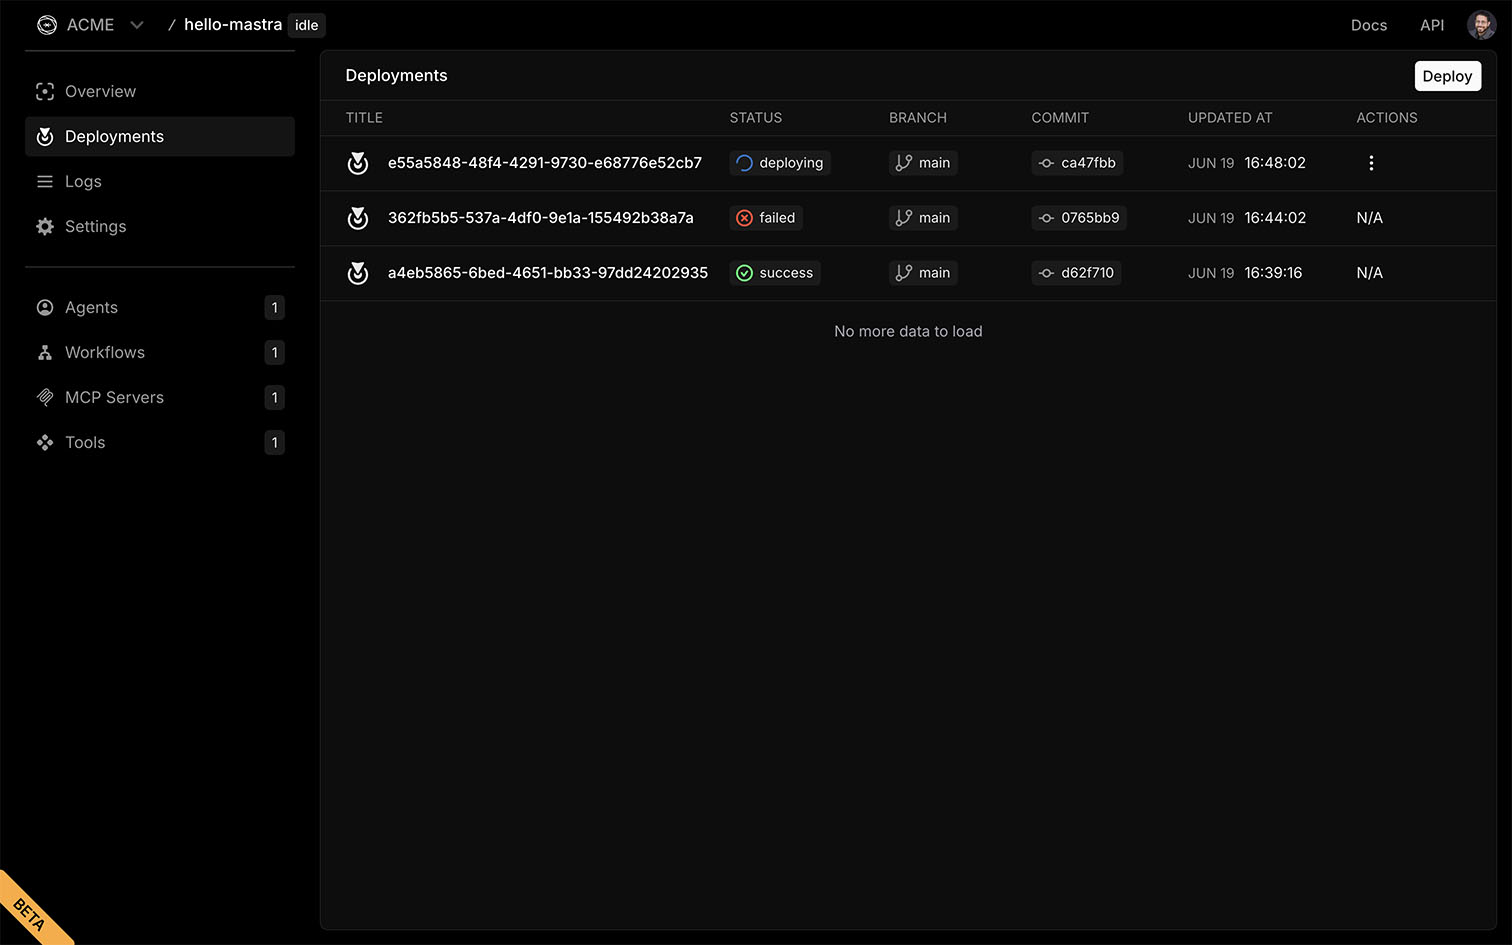
Key features:
Each deployment includes its current status, the Git branch it was deployed from, and a title generated from the commit hash.
LogsDirect link to Logs
The Logs page is where you'll find detailed information to help debug and monitor your application's behavior in the production environment.
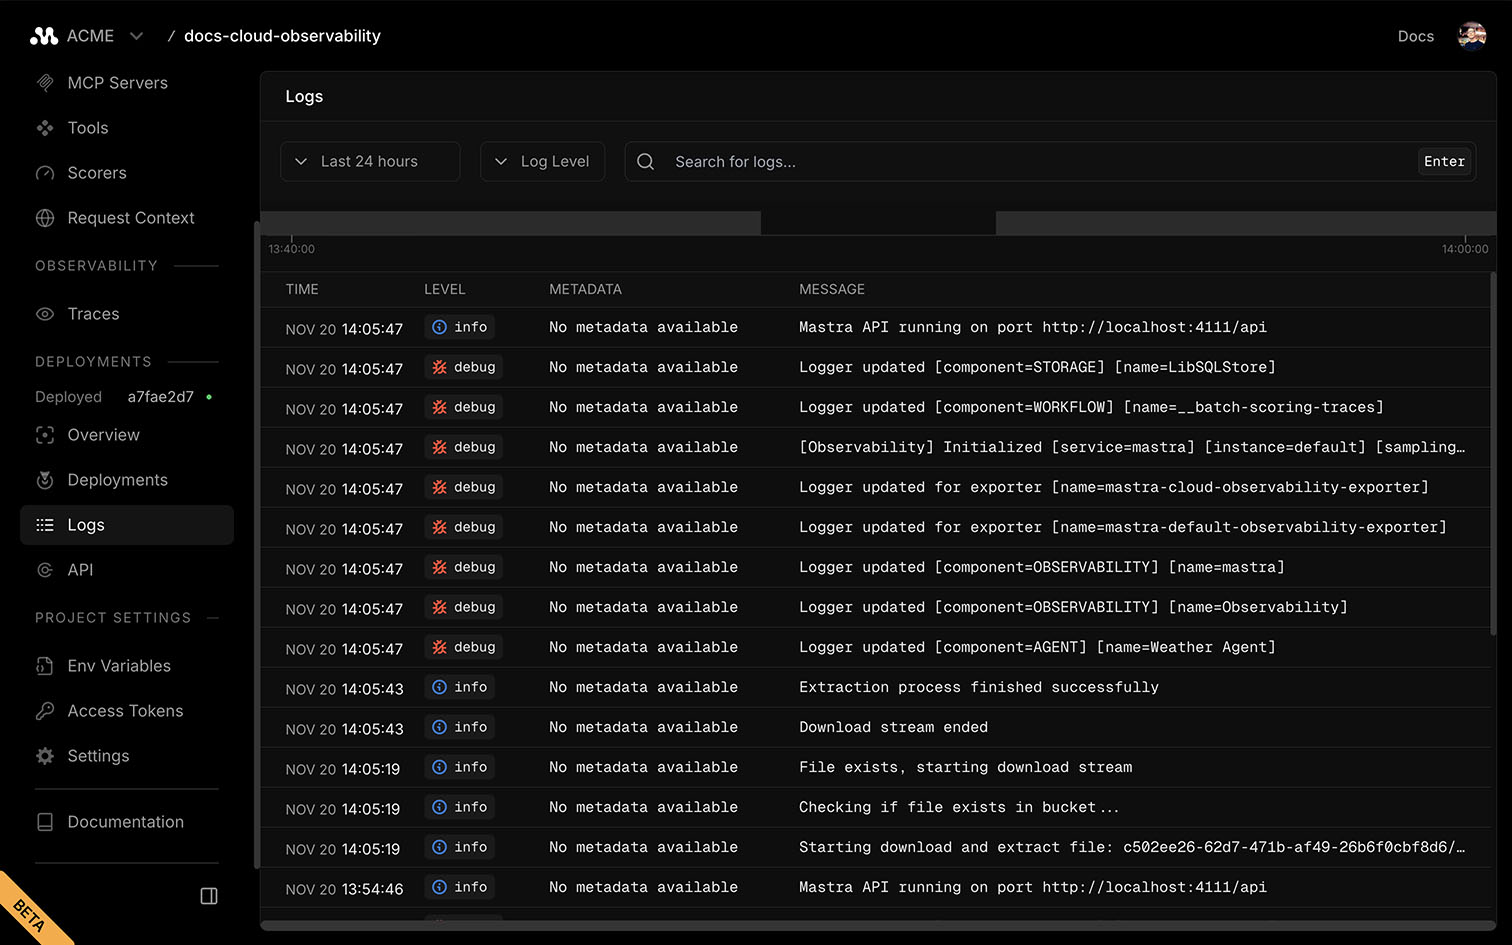
Key features:
Each log includes a severity level and detailed messages showing agent, workflow, and storage activity.
SettingsDirect link to Settings
On the Settings page you can modify the configuration of your application.
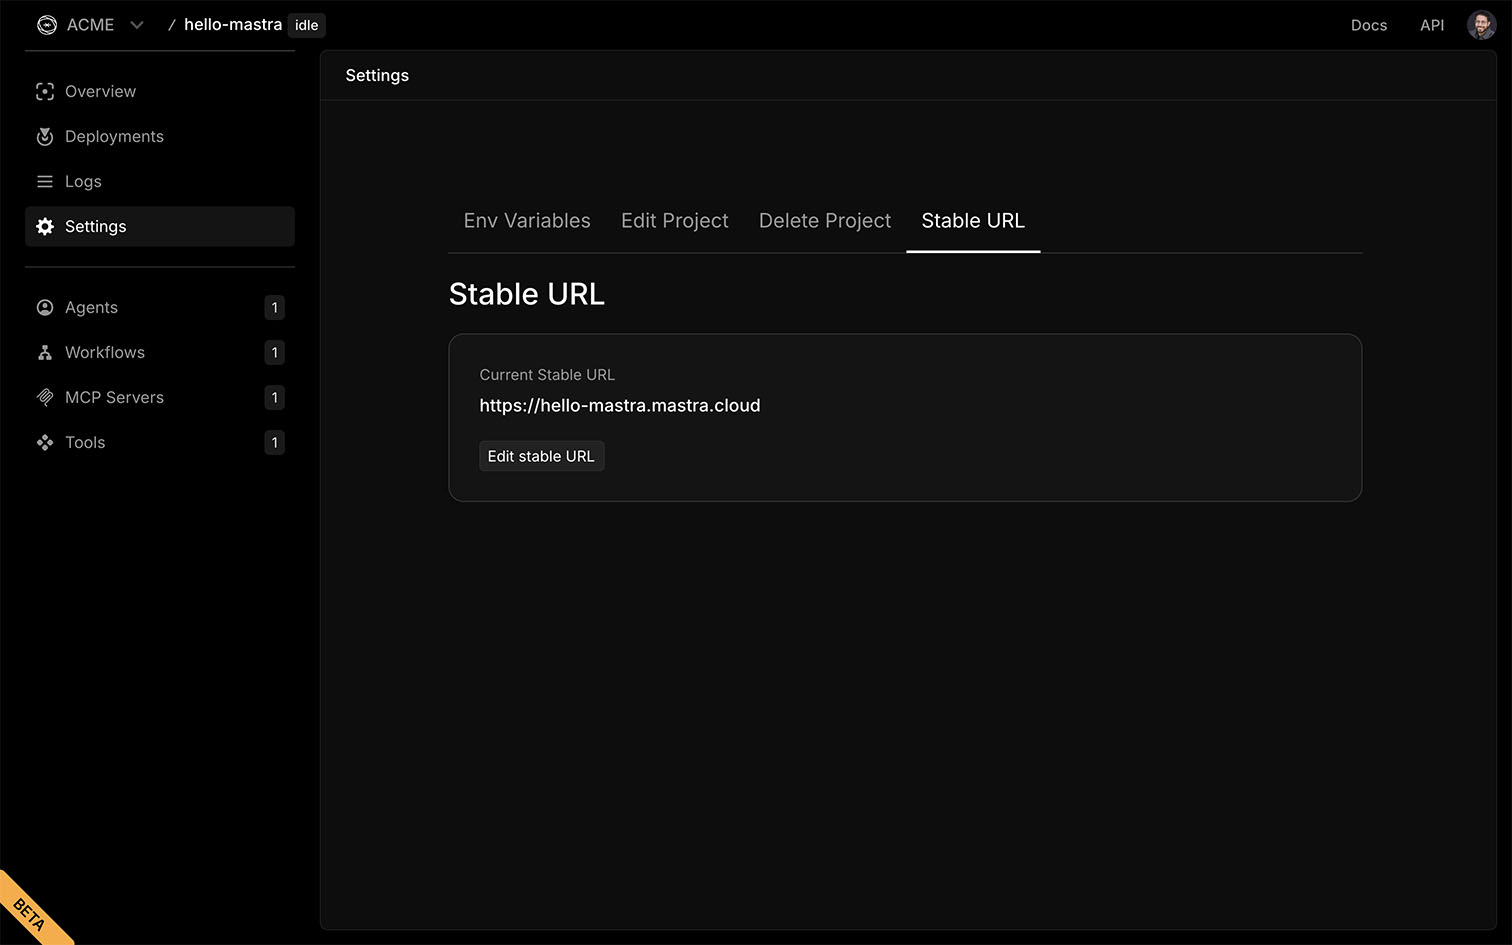
Key features:
You can manage environment variables, edit key project settings like the name and branch, configure storage with LibSQLStore, and set a stable URL for your endpoints.
Changes to configuration require a new deployment before taking effect.
StudioDirect link to Studio
AgentsDirect link to Agents
On the Agents page you'll see all agents used in your application. Click any agent to interact using the chat interface.
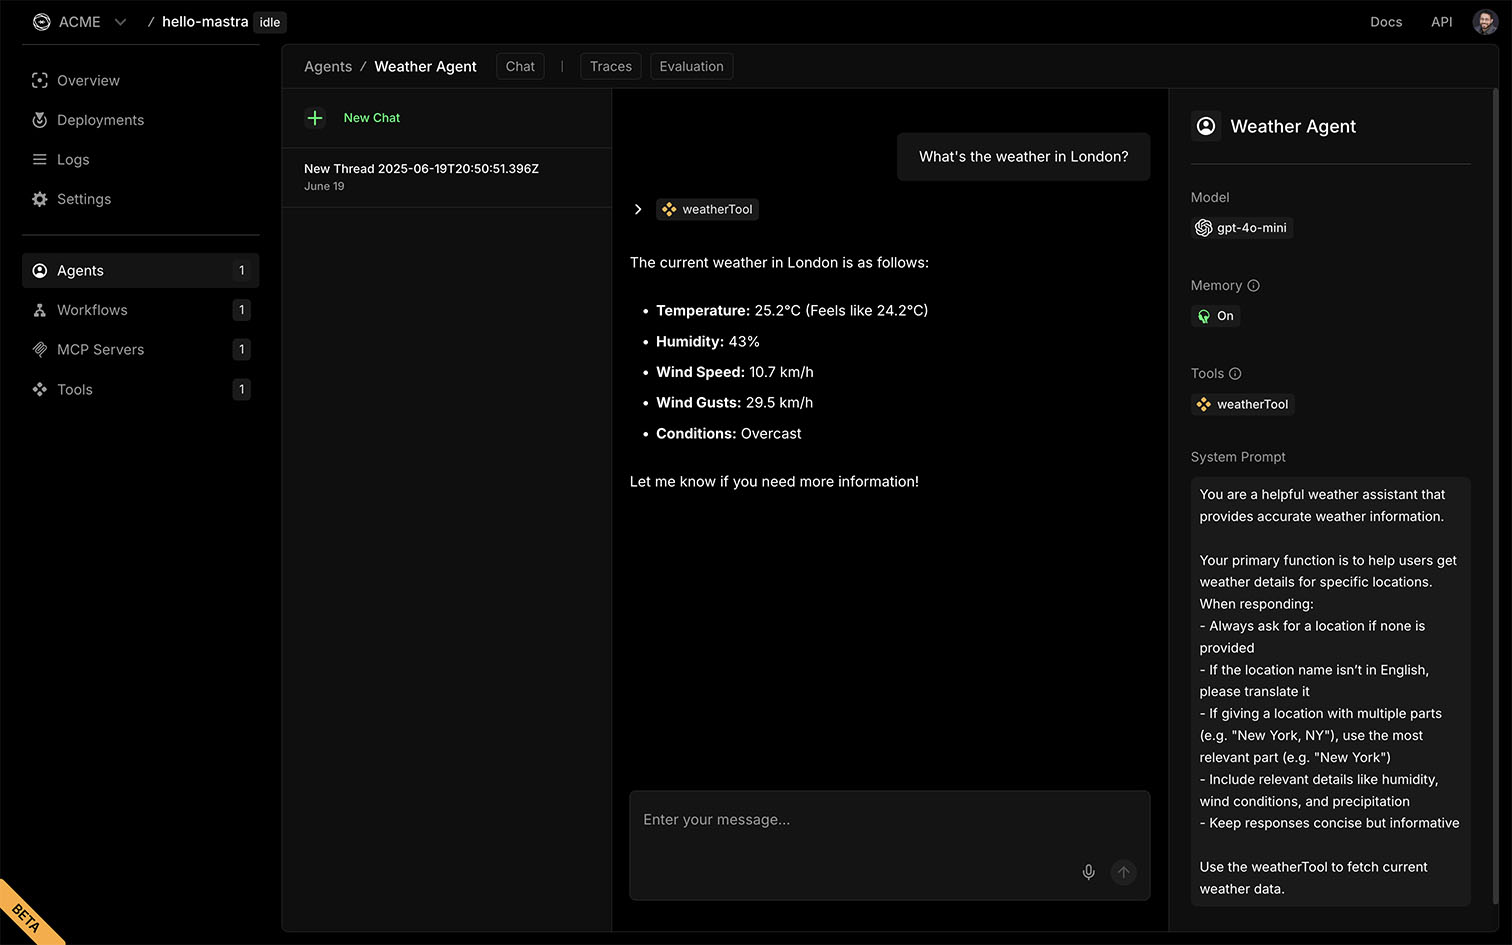
Key features:
Test your agents in real time using the chat interface, review traces of each interaction, and see evaluation scores for every response.
WorkflowsDirect link to Workflows
On the Workflows page you'll see all workflows used in your application. Click any workflow to interact using the runner interface.
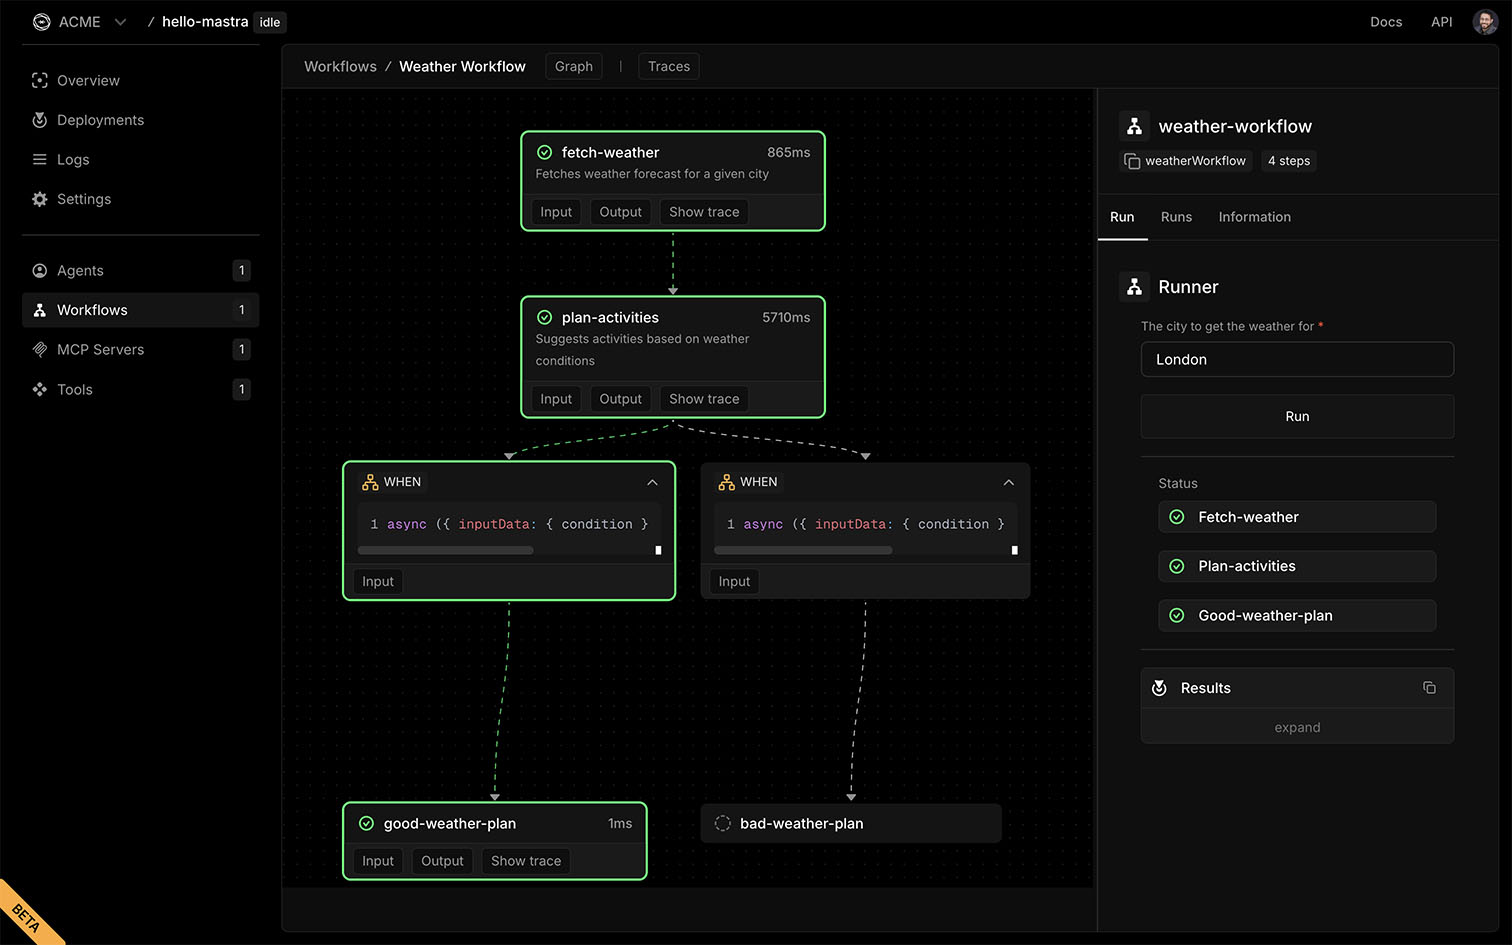
Key features:
Visualize your workflow with a step-by-step graph, view execution traces, and run workflows directly using the built-in runner.
ToolsDirect link to Tools
On the Tools page you'll see all tools used by your agents. Click any tool to interact using the input interface.
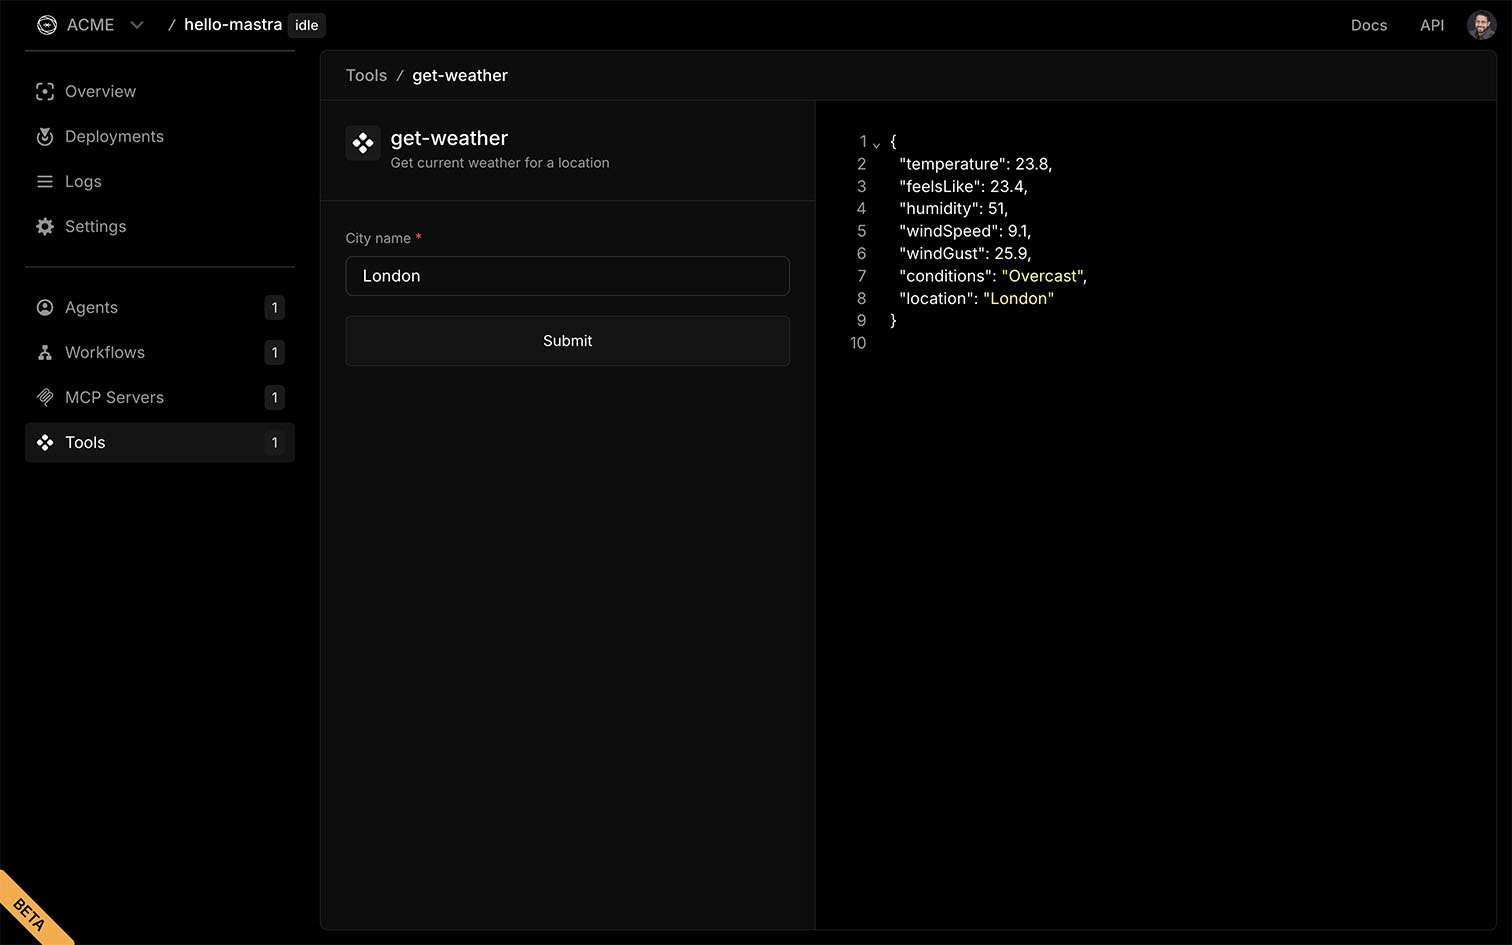
Key features:
Test your tools by providing an input that matches the schema and viewing the structured output.
MCP ServersDirect link to MCP Servers
The MCP Servers page lists all MCP Servers included in your application. Click any MCP Server for more information.
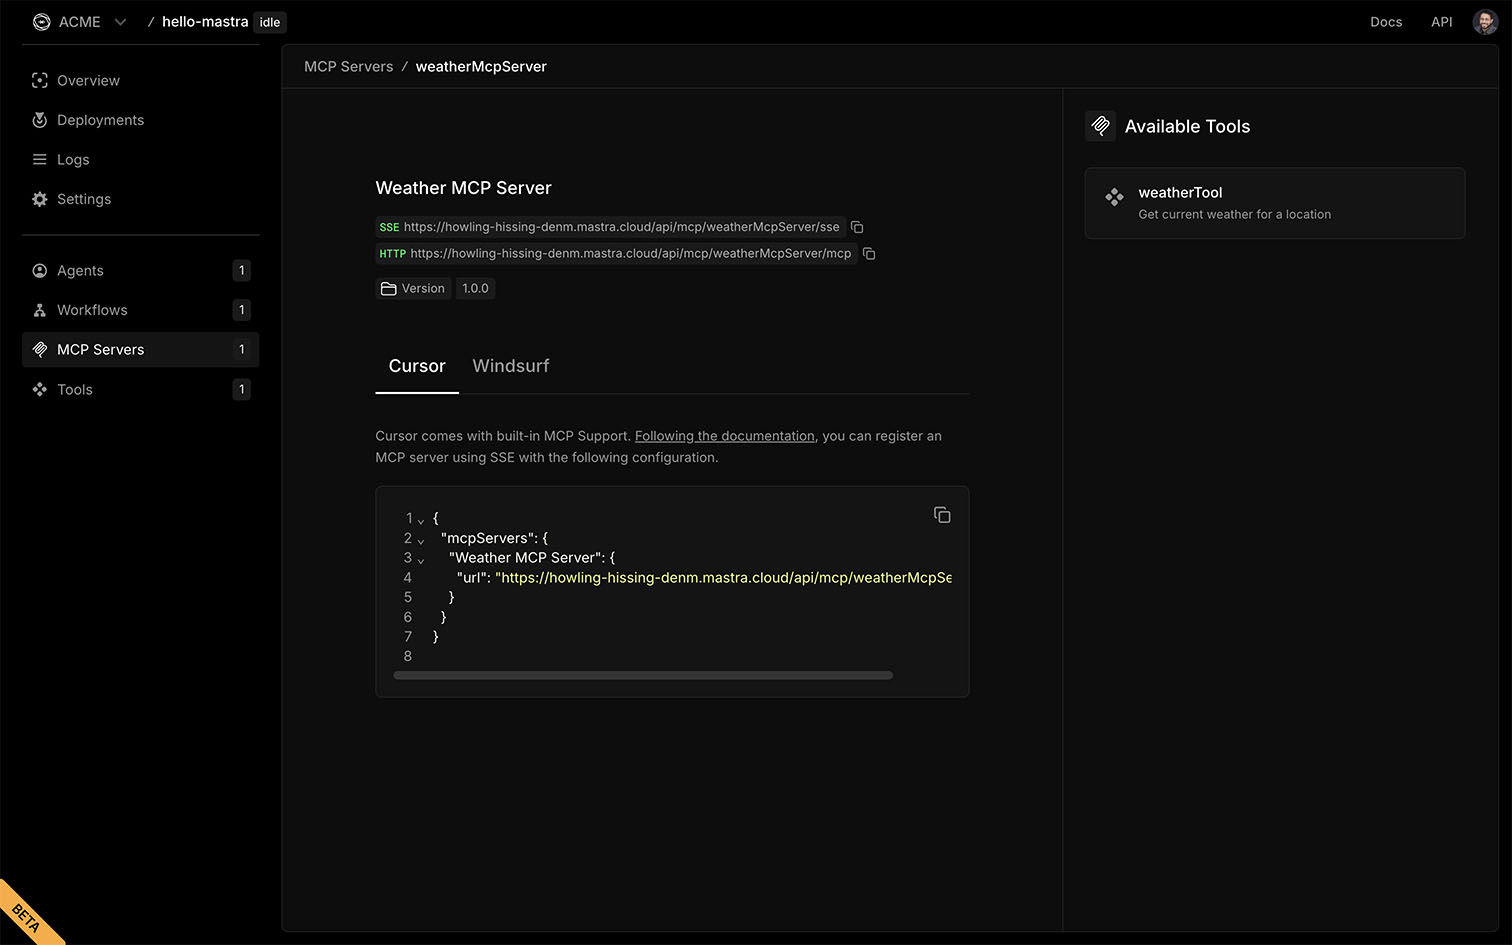
Key features:
Each MCP Server includes API endpoints for HTTP and SSE, along with IDE configuration snippets for tools like Cursor and Windsurf.