Understanding Tracing and Logs
Mastra Cloud provides full observability for production applications, giving you insight into how your agents and workflows behave. Observability can be enabled whether your application is deployed to Mastra Cloud, running locally, or hosted on your own infrastructure. Any Mastra project can send traces and logs to the platform regardless of where it's running.
For details on configuring observability, see the Cloud Exporter docs.
Deploy and monitor your Mastra applications with Mastra Cloud. Get automated deployments, detailed observability, and a built-in Studio for testing agents and workflows.
TracesDirect link to Traces
More detailed traces are available for both agents and workflows by enabling observability using one of our supported providers.
AgentsDirect link to Agents
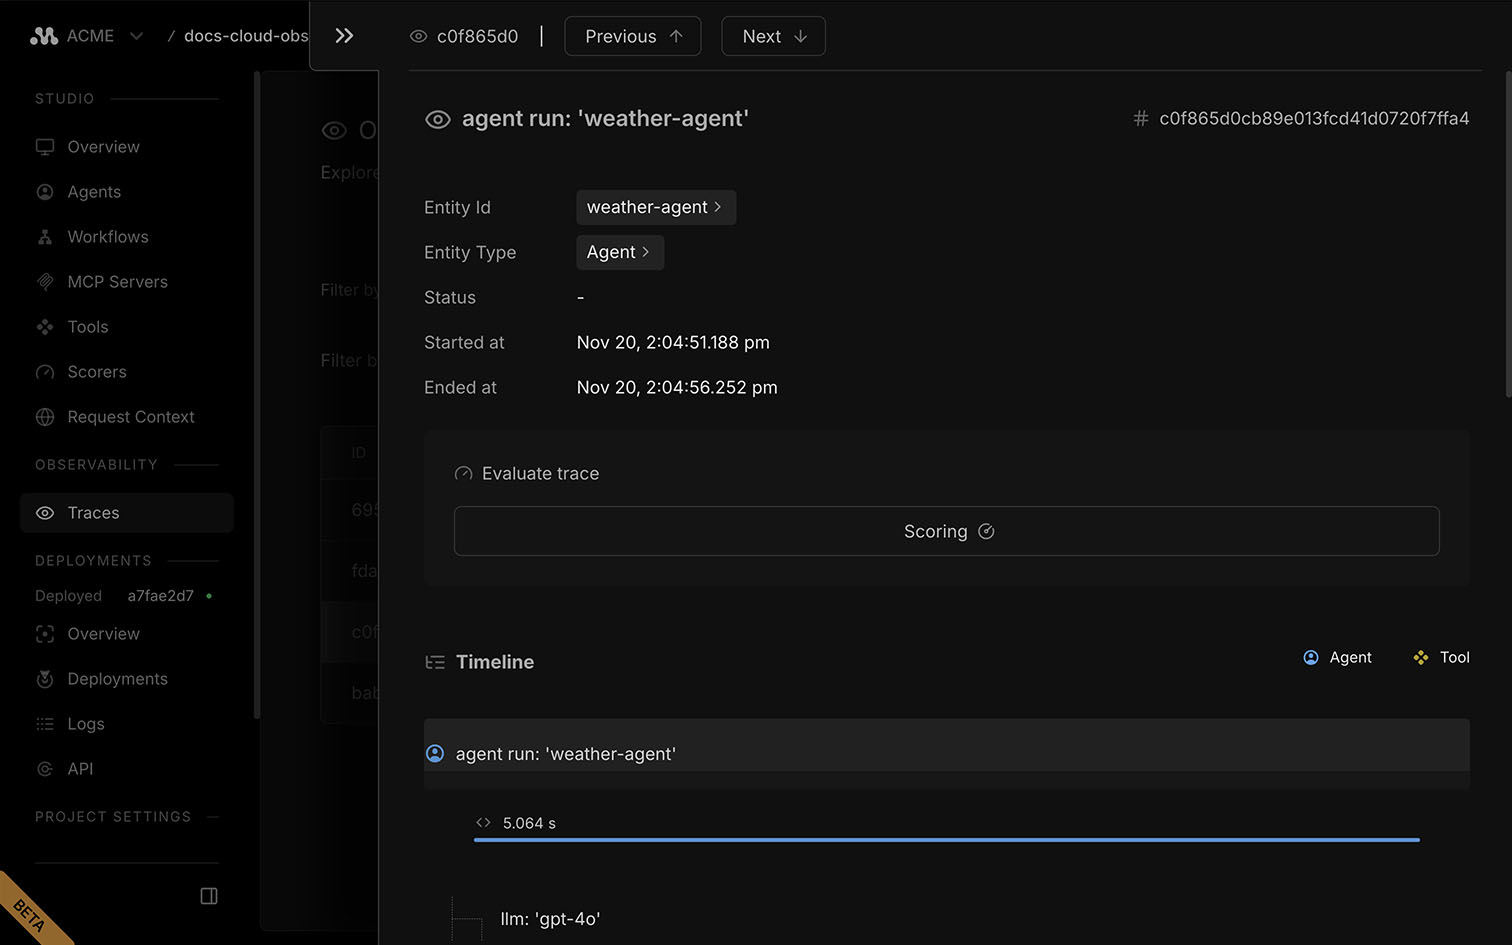
With observability enabled, you can view detailed outputs from your agents in the Traces section in Studio.
Key features:
Agent traces break a run into clear steps, model calls, tool calls, and intermediate chunks, each with timing, inputs, outputs, and errors. You can drill into any span to inspect prompts, token usage, and results, making it easy to diagnose issues and understand how the agent produced its output.
WorkflowsDirect link to Workflows
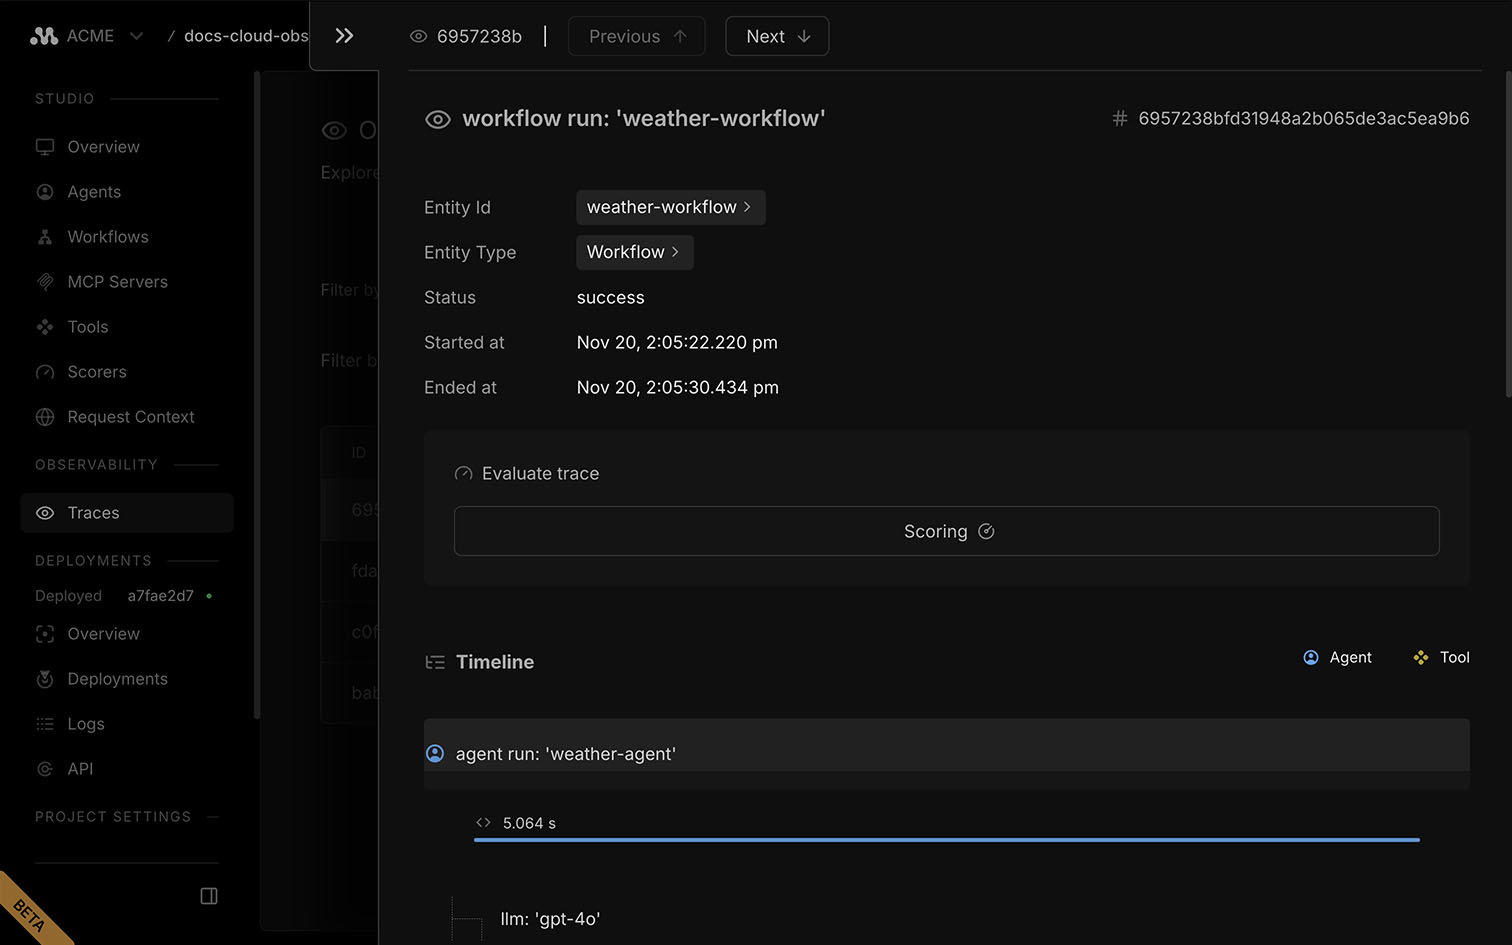
With observability enabled, you can view detailed outputs from your workflows in the Traces section in Studio.
Key features:
Workflow traces capture each step in the run, including transitions, branching, timing, and any tool calls inside the workflow. You can inspect inputs, outputs, and errors for every step, making it easy to debug long-running or multi-step processes and understand how data flows through the workflow.
LogsDirect link to Logs
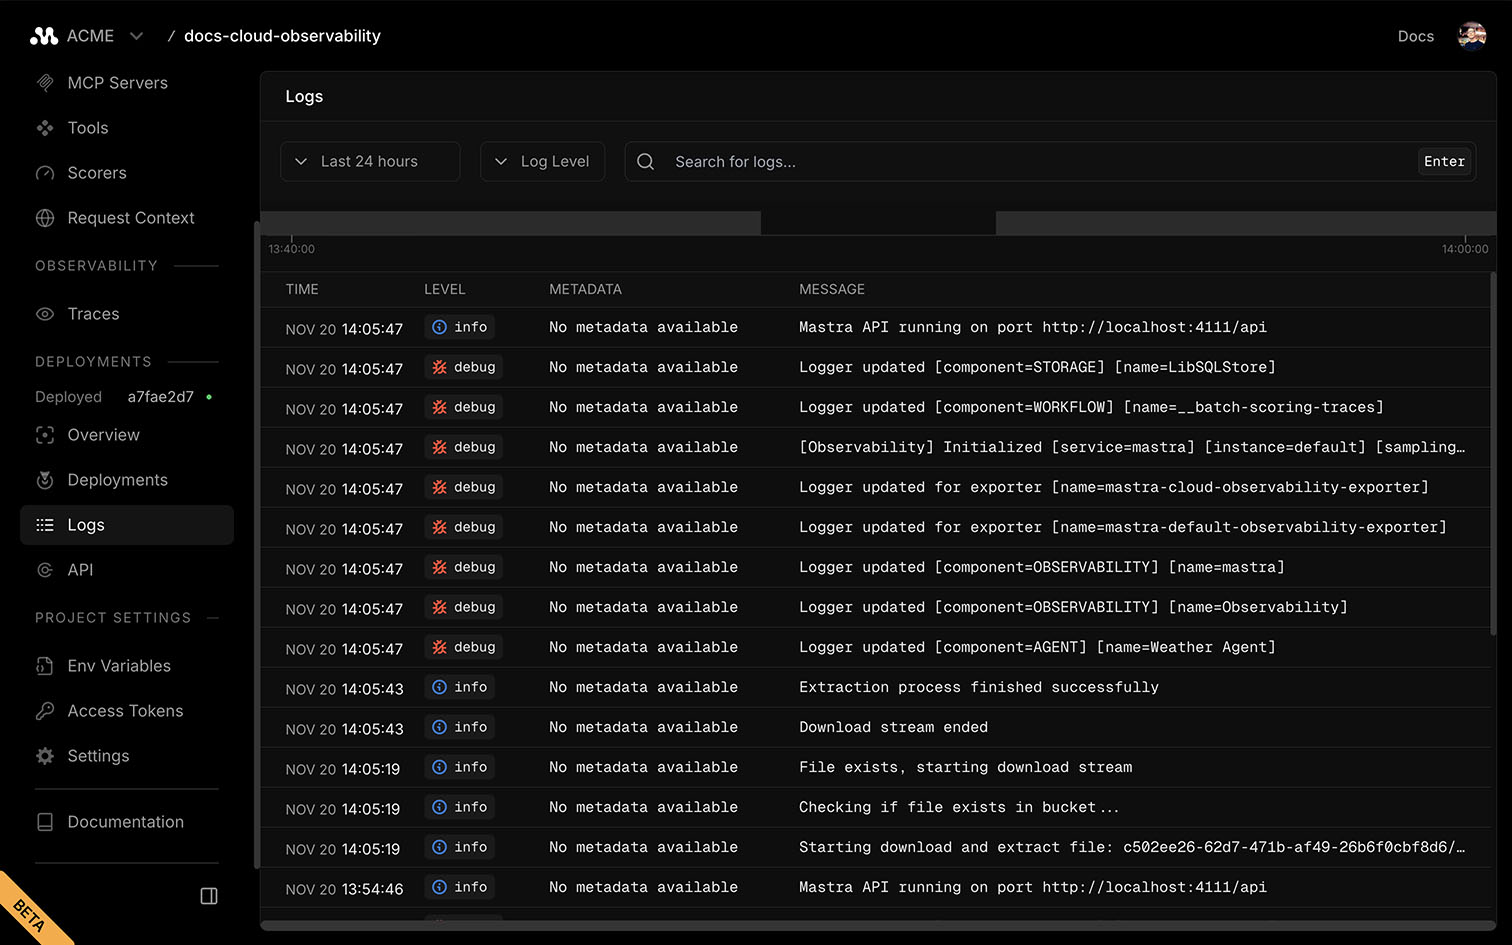
You can view detailed logs for debugging and monitoring your application's behavior on the Logs page of the Dashboard.
Key features:
Each log entry includes its severity level and a detailed message showing agent, workflow, or storage activity.